Compass Intelligence: November 5, 2025
Mike Simonsen, Chief Economist
The Fall 2025 real estate market isn't just one story; it's two different markets entirely. After years of volatility, new data reveals a fascinating split in the U.S. housing landscape, driven by inventory, migration patterns, and shifting mortgage rates.
Based on the latest data from Compass Intelligence, a "latest opportunity" has emerged for buyers as mortgage rates dip, while sellers face a more challenging environment. Here’s a breakdown of the key trends shaping the market right now.
A Glimmer of Opportunity: Rates and Demand
The biggest headline for buyers is the recent dip in mortgage rates to 6.17%. After peaking near 7.5% in late 2023, rates have provided windows of opportunity for buyers. Data shows that demand and prices picked up during two recent periods when rates neared 6% (Q1 2023 and Q4 2024).
This new, lower rate appears to be having a similar effect:
Mortgage Applications: Purchase mortgage applications, while still low compared to 2022, are showing signs of a "slightly improving market" and are tracking above 2023 and 2024 levels.
Pending Sales: Weekly pending home sales are running "a little better than 2024". Cumulatively, 2025 home sales are 0.9% ahead of last year.
While the market is still sensitive to Fed signals—the probability of a rate cut saw massive volatility after a recent Powell speech —the current rate dip is breathing some life back into buyer demand.

The "Great Stay": A Two-Tier Market
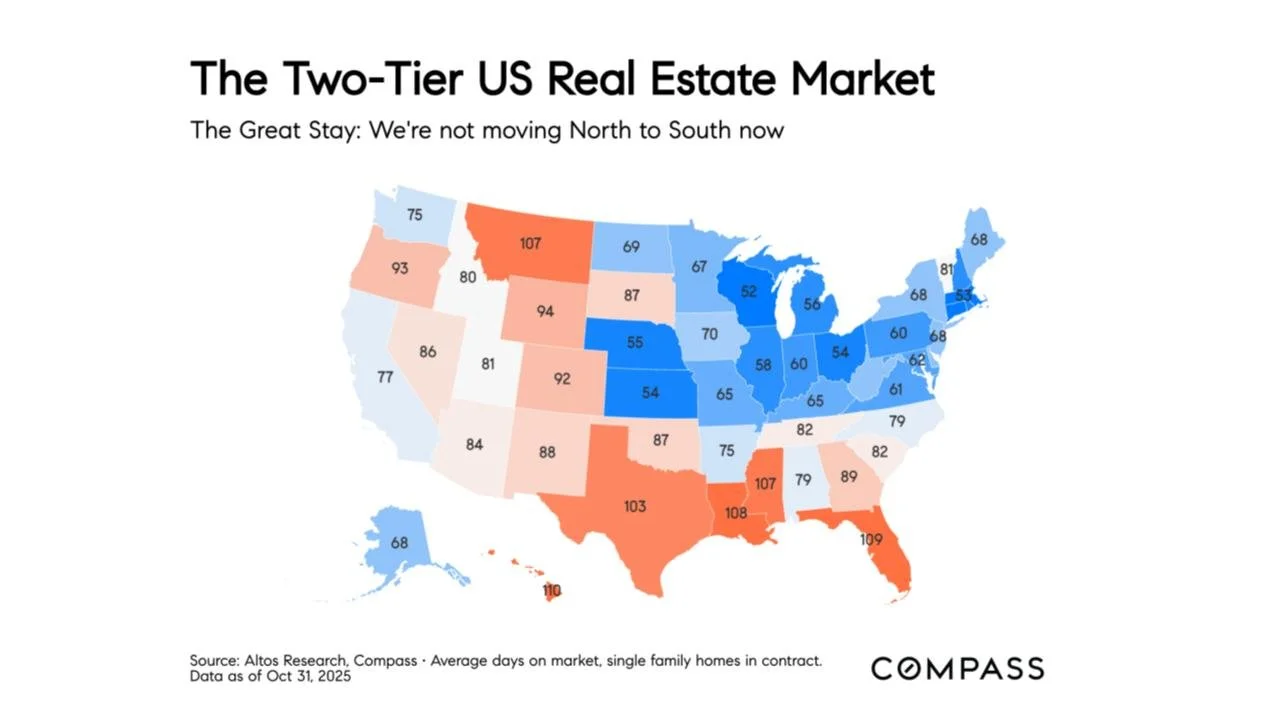
The most striking trend is the "Two-Tier US Real Estate Market". The data shows that the pandemic-era migration from the North to the South has stalled, a trend the report calls "The Great Stay".
This is most visible in the "Days on Market" (DOM) data:
Fast Markets (Blue): States in the Midwest and Northeast are seeing homes sell quickly. Nebraska (55 days), Illinois (58 days), and Ohio (60 days) have some of the lowest DOM averages.
Slow Markets (Red): States in the South and West are experiencing much slower markets. Florida (109 days), Texas (103 days), and Arizona (92 days) have significantly higher DOM averages.
This split is also clear in year-over-year home price data. Cities like Chicago and New York are showing price appreciation, while former hotspots like Phoenix, Dallas, and San Francisco are seeing price declines from last year.
The Driver: A Tale of Two Inventories
What's causing this massive split? The answer is inventory.
Nationally, unsold inventory is 16% greater than last year, giving buyers more options. However, this inventory is not spread evenly. When comparing today's inventory levels to pre-pandemic 2019, the two-tier market becomes crystal clear:
Northeast/Midwest (Inventory Deficit): These markets are still starved for listings compared to 2019. Massachusetts is down -49%, New York is down -44%, and Illinois is down -60%. This lack of supply keeps the market competitive and fast.
South/West (Inventory Surplus): These markets are now flooded with listings compared to 2019. Texas has 48% more inventory, Florida has 27% more, and Arizona has 22% more. This surplus is slowing sales and giving buyers the upper hand.

The Seller's Dilemma: Price Cuts and Patience
This inventory imbalance has created a challenging environment for sellers, especially in the slower-growth markets.
Longer Wait Times: On average, homes are taking 15% longer to sell this year. The current median Days on Market is 49 days, up significantly from the pandemic lows.
More Price Cuts: With more competition and longer wait times, sellers are being forced to adjust. A high 41.9% of all active listings currently have a price reduction. This is a higher rate than in both 2023 and 2024. States like Oregon (47.1%), Arizona (46.2%), and Utah (46.2%) have the highest rates of price cuts.
Giving Up: Many sellers aren't finding the price they want and are opting to pull their homes off the market. The percentage of withdrawn listings is spiking sharply as we head into the end of the year, far exceeding 2023 levels.
This softness is just beginning to show up in asking prices. While the median price of pending sales has held relatively firm at $399,000 , the median asking price per square foot recently dipped 0.88% below 2024 levels, indicating that seller expectations are starting to come down.

Key Takeaways
A "latest opportunity" for buyers has emerged as mortgage rates have fallen to 6.17%.
This has fueled a slight rebound in demand, with pending sales and mortgage applications ticking up from last year.
The U.S. is now a "two-tier market". The Midwest and Northeast remain fast, competitive markets, while the South and West have slowed significantly.
This split is driven by inventory: the Northeast still has a massive deficit from 2019, while the South has a large surplus.
Sellers are facing headwinds, with homes taking 15% longer to sell and over 41% of listings resorting to a price cut.
Have questions about the market? Let's connect and explore the best strategies for your real estate goals.
Compass does not recommend one particular strategy or guarantee of results.*
Featuring

Mike Simonsen
Chief Economist